POC Context Indicator
See where the volume really traded. The POC Context Indicator plots the Point of Control and Value Area directly on your chart — no automation, just the clearest view of where the market found value.
🔒 No commitment · Cancel anytime · Auto-renewal
What is the POC Context Indicator?
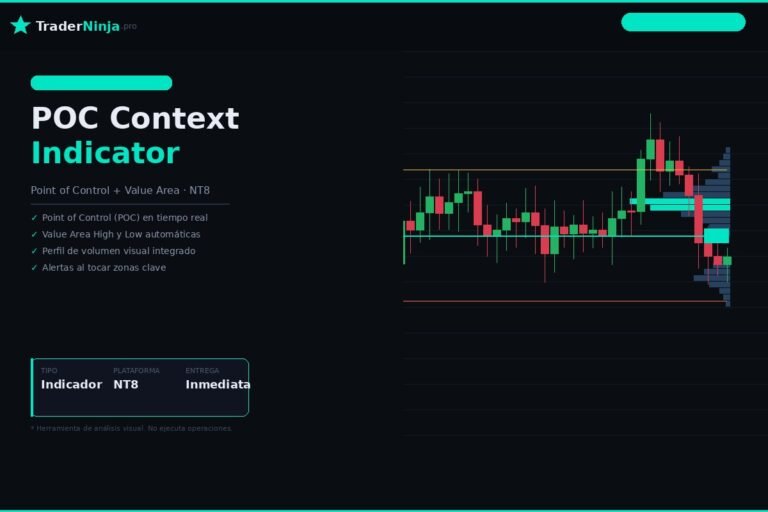
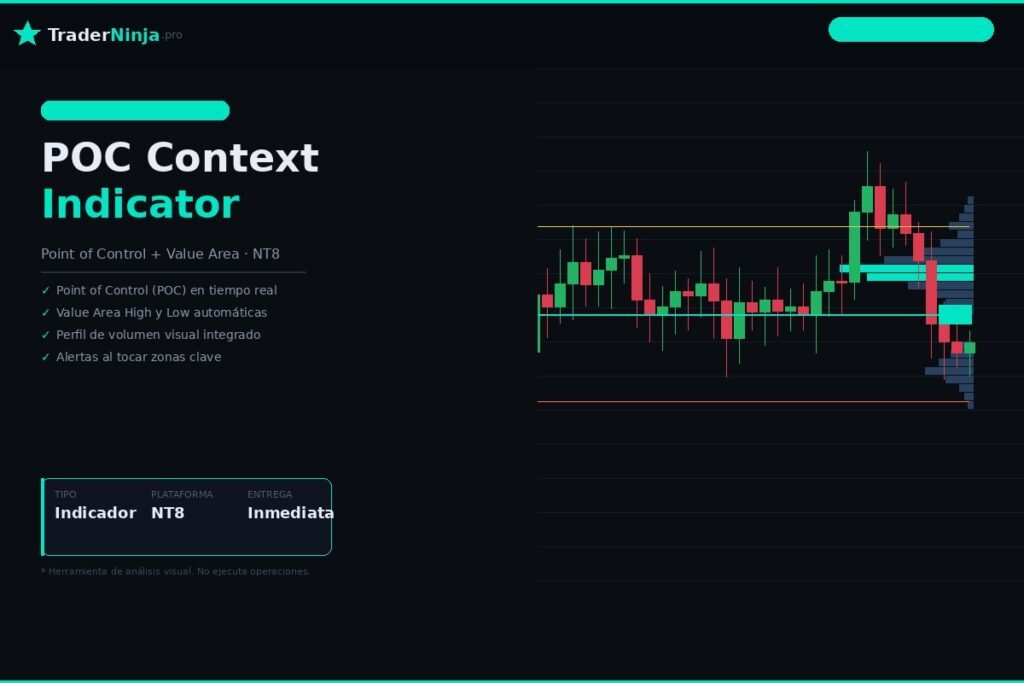
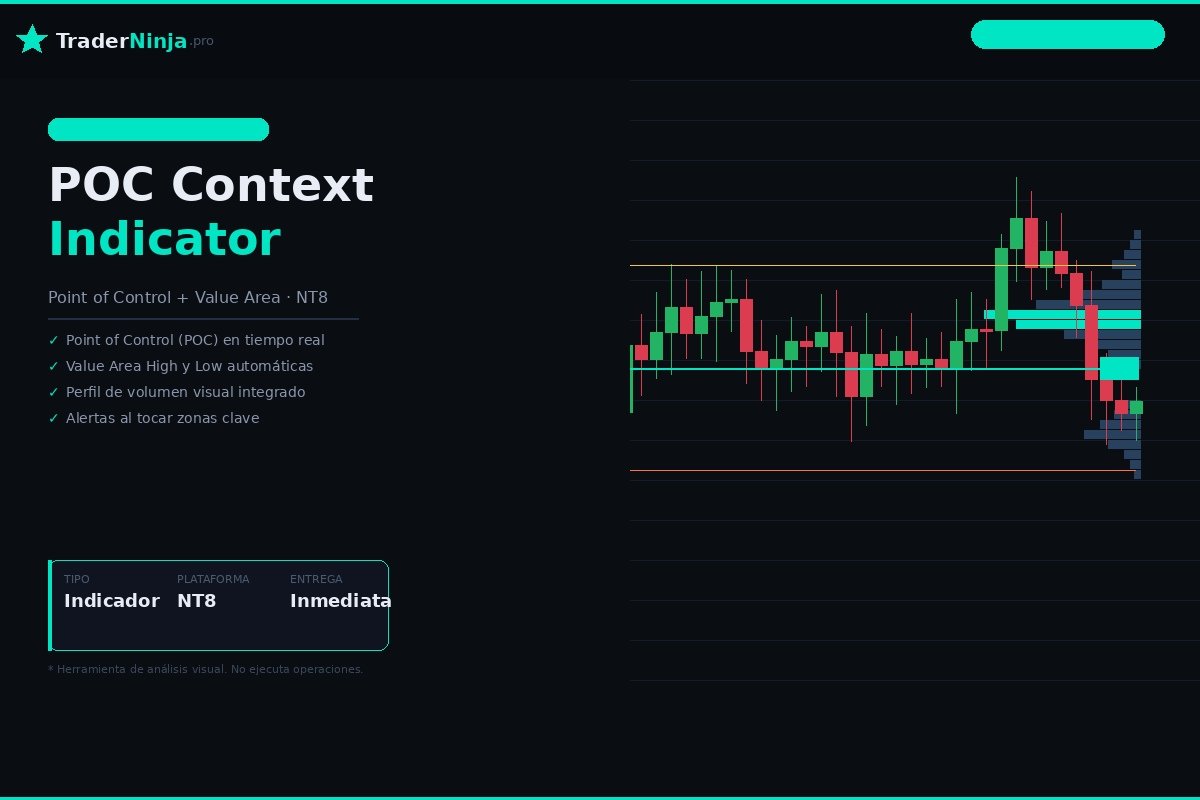
The POC Context Indicator plots the Point of Control (POC) — the price level with the highest traded volume during the session — directly on your chart, along with the Value Area High (VAH) and Value Area Low (VAL).
Unlike a strategy, this indicator does not place any trades. It simply gives you a clear visual map of where the volume actually traded, so you decide how to use that context in your own trading decisions.
The POC often acts as a price magnet — markets tend to gravitate back toward it. Having this level clearly marked helps you anticipate potential reaction zones throughout the session.
Reading the volume profile context
The market doesn't move randomly — it follows the footprint of where volume actually traded. The Market Profile reveals these zones, and the POC is the single most significant level within it.
This indicator automates the reading of the volume profile, plotting the POC, VAH, and VAL in real time as the session develops, so you always know where the highest-interest zones are.
POC, VAH and VAL recalculate in real time as the session progresses, reflecting changes in volume distribution.
Each level is color-coded and labeled directly on the chart for instant recognition — no guesswork.
Price tends to gravitate back toward the POC repeatedly. Having it clearly marked helps you anticipate potential reaction zones.
Adjust the profile period (session, prior day, week) directly from the indicator settings — no coding required.
Everything this indicator includes
Requirements and compatibility
| Platform | NinjaTrader 8 (v8.0.23.0+) |
| Operating system | Windows 10 / 11 (64-bit) |
| Product type | Visual Indicator (NinjaScript .zip) |
| Compatible instruments | Any instrument available in NinjaTrader 8 |
| Timeframes | Any (Time, Tick, Renko, Volume) |
| Delivery | Instant .zip download after payment |
| License | Personal · 1 device · non-commercial |
| Updates | Included at no extra cost |
| Support | soporte@traderninja.pro |